All Rights Reserved@Hangzhou Hyperspectral Imaging Technology Co., Ltd. 浙ICP备19040412号-2 网站地图
Design By: Yushangweb
Agroforestry Ecosystem

Industry status


Agricultural Planting Area: As a country with a large population, China is also a major grain producer. In 2024, the sown area for rice reached 29.01 million hectares, wheat reached 23.59 million hectares, corn reached 44.74 million hectares, and soybeans reached 10.33 million hectares.

Forestry Planting Area: In 2024, the national afforestation area completed was 4.446 million hectares, grassland improvement area was 3.224 million hectares, and the area of desertified and rocky desertified land under control was 2.783 million hectares. The forest coverage rate exceeded 25%, with a forest stock volume of over 20 billion cubic meters. Notably, the national economic forest planting area reached approximately 70 million mu (about 4.67 million hectares).

The healthy development of agriculture and forestry is of paramount importance to national food security and ecological security. However, the current monitoring and management of farmland and forests across the country still rely heavily on manual patrols, with limited deployment of intelligent equipment. Critical aspects such as soil pollution, soil moisture, non-point source pollution, and biodiversity lack real-time growth prediction models for agroforestry vegetation. Additionally, pest and disease diagnosis depends on manual experience, often leading to missed optimal windows for prevention and control.


图片5.png

Pain Points in Ecological Management

  • Soil Degradation: Over 40% of China's farmland suffers from acidification and compaction due to excessive fertilizer use (Source: Ministry of Agriculture and Rural Affairs, 2024 Report).

  • Losses from Diseases and Pests: For instance, Pine Wilt Disease causes an average annual economic loss of over 8 billion CNY in the forestry sector, while traditional monitoring methods are inefficient and slow to respond.

Agricultural Transformation Needs

  • Precision Agriculture: Flood irrigation leads to significant water waste, necessitating fertilization and irrigation based on actual crop needs.

  • Quality Upgrade: The production of high-end agricultural products requires non-destructive testing for metrics like sugar content and nutritional composition.

Technological Solution

The development of hyperspectral remote sensing technology provides a novel means for monitoring plant growth. This technology can supply detailed information on plant physiological and biochemical parameters, which is crucial for understanding plant growth status and health. With the advancement of precision agriculture, the demand for real-time monitoring of crop status is rapidly growing. Hyperspectral remote sensing can deliver key physiological parameters during crop growth—such as nitrogen content, chlorophyll content, and water status—holding significant importance for guiding agricultural practices.

图片6.png

Technical Background

Hyperspectral imaging technology is a novel remote sensing technique that emerged in the early 1980s. By organically integrating image morphological measurement with spectroscopic analysis, it represents the future development direction of new detection technologies.


图片7.png

b944e9c1-ce5e-464a-b1bf-136851967419.png

image.png

Product solution

c3b15d41-331f-456f-ab03-155e8e193c65.png                                              Hyperspectral UAV-Mounted System


The HY-9010-L hyperspectral UAV-mounted system utilizes cutting-edge hyperspectral imaging technology to fully exploit the unique spectral signatures of different materials. Integrated with a high-definition camera, it achieves comprehensive detection of qualitative, quantitative, temporal, and locational information, serving as an all-in-one remote sensing device that combines spectral and spatial data.

This system incorporates both a hyperspectral camera and an HD camera, enabling synchronous multi-dimensional data acquisition during operations. It supports real-time mission monitoring and remote control, while its built-in high-performance processing unit allows for real-time ground object reflectance calculation and analytical inversion. The system is widely applicable in water environment monitoring, smart agriculture, forestry surveys, target identification, military camouflage detection, and other scenarios, meeting diverse industrial needs.


1f37ed31-30ee-4ba7-99fa-5f6687147808.png

Product Functional Features Description


  1. High Spectral Resolution: Boasts a spectral resolution better than 2.8 nm, enabling precise analysis of spectral characteristics for various ground objects.

  2. Large-Format CMOS Sensor: Features a large-target CMOS hyperspectral camera supporting up to 1920 spatial channels and 1200 spectral channels.

  3. Ample Onboard Storage: The onboard control and acquisition system includes a built-in 1TB SSD, ensuring reliable and sufficient data storage capacity.

  4. Synchronized High-Definition Imaging: Incorporates a hardware-synchronized high-definition visible light camera with 15-megapixel resolution, supporting high-precision orthophoto mosaic generation.

  5. Integrated Gimbal & Efficient Scanning: Equipped with a built-in gimbal stabilization system and utilizes UAV push-broom imaging (non-hover scanning), significantly enhancing operational efficiency.

  6. Seamless UAV Integration: Deeply compatible with UAV platforms, requiring only a single data cable for connection to provide integrated power supply and data communication. Simultaneously acquires GPS information, correlating it line-by-line with the hyperspectral data.

  7. Remote Intelligent Control: Enables remote intelligent control for user-friendly operation, effectively preventing ineffective flight missions.

  8. Real-Time Visualization: Capable of real-time rendering of multi-band spectral composite images, allowing real-time monitoring of the hyperspectral acquisition scene and spectral curves of specific spatial points.

  9. Advanced Spectral Analysis: Pre-loaded with calculations for over 20 common indices (e.g., NDVI), supports custom band operations, and offers various spectral processing and analysis functions.

  10. Water Quality Parameter Retrieval: Capable of inverting key water quality parameters such as Chlorophyll-a, Total Nitrogen (TN), Total Phosphorus (TP), Ammonia Nitrogen (NH₃-N), Permanganate Index (COD<sub>Mn</sub>), and Suspended Solids (SS).


HY-9010-L高光谱挂载系

模块

名称

指标

参数

主机 

高光谱相机

光谱范围

400-1000nm

光谱分辨率

优于2.8nm

空间分辨率

1.56mrad @f=16mm

视场角

38°@f=16mm

空间通道数

480(4x)

光谱通道数

300(4x)

狭缝宽度

25μm

探测器类型

CMOS

探测器接口

USB 3.0

探测器靶面尺寸

1/1.2”

像素位深

12bits

帧频

50fps

镜头焦距

16mm

高清相机

像素

1500万

控制与采集模块

硬件配置

CPU:I7,内存:16g,硬盘:1TB

GPS定位

支持RTK模式

(需开通相应服务)

定位精度优于250px

其它参数

工作电流

峰值电流:3A

输入电压

13.6V

重量

约3kg

工作温度

0-40°C

储存温度

0-50°C

地面站

地面站参数

工作时间

约4小时

工作电流

峰值电流:1.5A

输入电压

11.1V

重量

约1kg(不含电源)

工作温度

0-40°C

储存温度

0-50°C


HY-9010-L高光谱挂载系

软件

主机控制与采集数据软件

功能

可实时渲染多波段光谱合成图,可实时监控高光谱采集画面和空间点光谱曲线;支持实时自动反射率计算支持速高比计算,积分时间推荐,空间分辨率计算等

地面站远程控制软件

功能

通过地面站与主机进行远程通信,并对设备进行控制及参数调整。

数据处理及分析软件

数据预处理

光谱及图像数据查看、反射率计算、辐射校正、滤波、暗背景扣除、光谱降噪、空间降噪、掩膜导出、高光谱图像的裁切、旋转、翻转等

数据拼接

高光谱图像拼接,无需借助GPS数据对多条带的高光谱数据进行裁切及拼接,内置拼接线匀光算法,拼接线可手动调整优化

常用指数计算

内置归一化植被指数(NDVI)、比值植被指数(RVI)、增强植被指数(EVI)、大气阻抗植被指数(ARVI)、 红边归一化植被指数(NDVI 705)、改进红边比值植被指数(mSR 705)、改进红边归一化植被指数(mNDVI 705)、Vogelmann 红边指数(VOG1、2、3)、光化学植被指数(PRI)、结构不敏感色素指数(SIPI)、归一化氮指数(NDNI)、植被衰减指数(PSRI)、类胡萝卜素反射指数1(CRI1)、类胡萝卜素反射指数2(CRI2)、花青素反射指数1(ARI1)、花青素反射指数2(ARI2)、水波段指数(WBI)、归一化水指数(NDWI)、水分胁迫指数(MSI)、归一化红外指数(NDII)、归一化木质素指数(NDLI)、纤维素吸收指数(CAI)20多种植被指数计算

数据分析

内置光谱角等高光谱数据分析算法,支持自建模型的监督分类,支持自定义分析模型输入功能,自定义波段运算;

多参数水质反演

可计算叶绿素、总氮、总磷、氨氮、高锰酸盐指数、悬浮物、溶解氧等水质参数的反演


95d5e8f4-7250-4947-9ec5-86447e9659ba.png    

The hyperspectral UAV-mounted system enables synchronous multi-dimensional data acquisition, allowing for the collection of hyperspectral image data across 300 spectral bands and high-definition visible-light photographs in a single flight. The accompanying software supports the calculation of various common indices, such as NDVI and NDWI. Additionally, equipped with built-in multi-parameter water quality inversion algorithms, the system can accurately retrieve key indicators—including Total Nitrogen (TN), Total Phosphorus (TP), Ammonia Nitrogen (NH₃-N), Permanganate Index (CODMn), Chlorophyll-a (Chl-a), and Suspended Solids (SS)—and generate clear, intuitive concentration distribution maps to facilitate precise pollution source tracking.


图片8.png


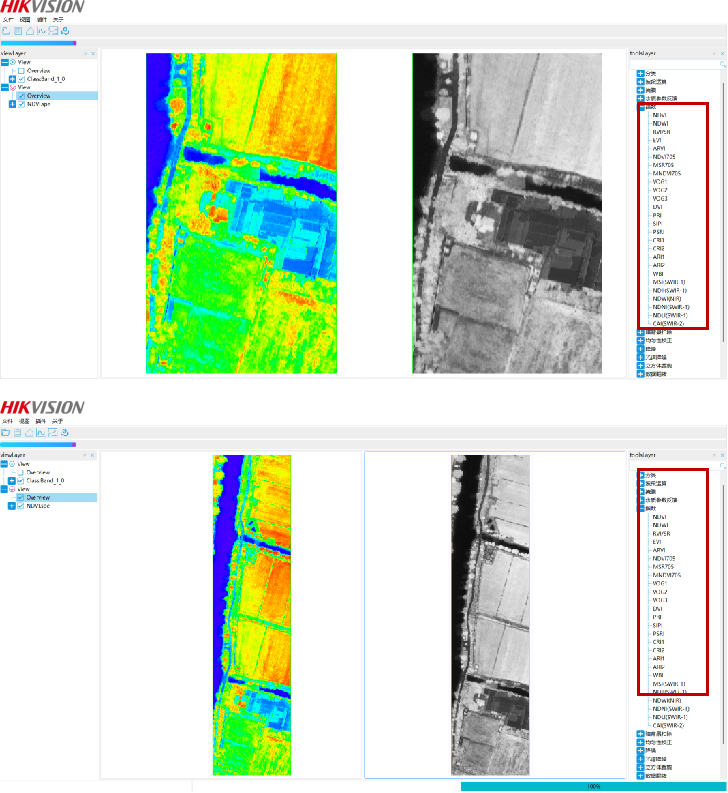
The data processing and analysis software配套 the hyperspectral mounting system comes pre-loaded with over 20 vegetation indices.

In remote sensing, the reflectance from different wavelength ranges is often combined to enhance vegetation characteristics, a process achieved through the calculation of Vegetation Indices (VIs). A Vegetation Index (VI) is used to quantitatively describe specific prominent features of vegetation.

While over 150 vegetation index models have been published in scientific literature, only a very limited number have undergone systematic practical validation. Based on the primary chemical components that significantly influence vegetation spectral characteristics—namely pigments, water, carbon, and nitrogen—the system incorporates seven major categories of highly practical vegetation indices. These are: Broadband Greenness, Narrowband Greenness, Light Use Efficiency, Canopy Nitrogen, Dryness or Carbon Decline, Leaf Pigments, and Canopy Water Content.

These indices provide straightforward metrics for assessing various vegetation properties, including: the quantity and vigor of green vegetation, chlorophyll content, leaf surface canopy characteristics, leaf clustering, canopy structure, the efficiency of photosynthetic light utilization, the relative nitrogen content within the vegetation canopy, estimating carbon content related to cellulose and lignin in a dry state, measuring stress-related pigments, and determining canopy water content.


Aerial Monitoring Procedure

image.png

Application Cases

Evaluation of the Growth Status of Hickory Nuts in Lin'an, Zhejiang Province

image.png

Remote Sensing Monitoring Study on Rice Growth in a Typical Paddy Field, Jiangsu Province

Using drone-borne hyperspectral technology, this study investigates the growth status of rice under different cultivation conditions and varieties through indices such as NDVI, NDWI, MSR705, and VOG, aiming to enhance scientific guidance for rice breeding and cultivation practices.image.png

Study on Nitrogen Content and Growth Status of Tobacco Leaves in Fujian Province

image.png

Vegetation Index Monitoring

图片9.png

Vegetation indices are combinations of spectral values from different bands, each carrying specific biochemical significance. Common types include ratio-based, linear combination, modified, and difference vegetation indices. The predictive effectiveness of these indices varies depending on the band combinations and the target metrics.

When crops experience stress, changes occur in nutrients (e.g., nitrogen), pigments, and enzymes. Monitoring these physiological indicators using vegetation indices helps assess stress levels, growth status, and yield potential. However, multispectral data, with only a limited number of bands, may not fully capture detailed physiological and biochemical information or growth conditions. In contrast, hyperspectral data—with hundreds or even thousands of spectral bands—offers a significant advantage. Even for the same type of vegetation index, hyperspectral data allows for thousands of potential band combinations. This vast range of combinations and available indices increases the likelihood of identifying sensitive indices tailored to monitoring specific physiological, biochemical, and growth parameters of crops.


Crop Nutrient Indicator Detection

图片10.png

Nitrogen and chlorophyll content are critical nutrient indicators in crops, closely related to crop yield. The acquisition of crop nutrient information based on spectral and imaging technologies can be classified into two approaches depending on whether spectral information is directly utilized: rapid nutrient assessment based on direct spectral information (e.g., stepwise multiple regression, partial least squares, weighting coefficients, support vector machines, etc.) and rapid nutrient assessment based on vegetation indices. The former involves modeling and detecting crop nutrients through processed raw spectral data, while the latter analyzes nutrients by establishing models between vegetation indices and nutrient levels.


Crop Water Stress Monitoring and Drought Monitoring

4058bc6c-469a-4d72-bb73-c6b8de0568d2.png   

In agricultural production, water and fertilizer are among the most critical factors affecting crop growth. Water is a major component of crops, and water deficit directly impacts physiological, biochemical processes, and morphological structure, thereby influencing crop development. Therefore, timely and accurate monitoring of crop water status is highly significant for improving water management practices and guiding water-saving agricultural production.

The use of hyperspectral imaging technology to monitor crop mineral nutrition and water stress, estimate nutrient and water requirements, and thereby guide fertilization and irrigation has emerged as a new technology in recent years.

Rapid acquisition of crop water stress information through spectral and imaging technologies facilitates precise control of water and fertilizer management. Prediction models based on hyperspectral data demonstrate superior performance compared to those based on multispectral imaging.


Crop Disease Stress Monitoring

a9944ed6-0a8e-4224-9244-92eaa437addc.png

      Early diagnosis of crop pests and diseases is of great significance for scientific control and ensuring crop yield. Currently, pest and disease diagnosis can be divided into direct and indirect methods. Direct methods primarily rely on chemical analysis techniques, including polymerase chain reaction (PCR) and DNA microarray methods. Indirect methods mainly involve sensor technologies such as electronic noses and spectrometers. Spectral and imaging technologies offer a fast, non-destructive, and effective detection technique for pest and disease diagnosis. When crops are subjected to pest or disease stress, both internal physiological indicators and external morphology change, manifesting as spectral responses and features like texture and color in spectral and imaging data. Consequently, spectral and imaging technologies diagnose crop stress by analyzing single or multiple spectral bands along with crop image information. Furthermore, vegetation indices commonly used for diagnosing pests and diseases include the Normalized Difference Vegetation Index (NDVI), Green Normalized Difference Vegetation Index (GNDVI), Ratio Vegetation Index (RVI), Photochemical Reflectance Index (PRI), Leaf Water Vegetation Index 1 (LWVI1), Water Index (WI), and Normalized Difference Water Index (NDWI).


Crop Fine Classification

90cc88f9-9b8e-4aff-94ba-ac48ab342830.png

      In hyperspectral agricultural remote sensing applications, precise crop classification and identification are crucial for agricultural disaster monitoring and yield assessment. The use of drones to acquire hyperspectral data enables the detection of finer spectral differences in crops and captures variations within narrower spectral ranges, allowing for accurate detailed classification and information extraction of crops. Currently, the most popular and widely used hyperspectral crop classification methods include Spectral Angle Mapper (SAM) and decision tree-based hierarchical classification.

Crop Growth Monitoring and Yield Prediction

24a5d707-1f9d-4718-a35d-15306ca194d4.png


Crop vigor is a comprehensive parameter for evaluating crop growth and development. Vigor monitoring involves the macroscopic observation of seedling conditions, growth status, and changes.

The construction of a relational model linking hyperspectral remote sensing data with crop physiological characteristics and growth vigor, supported by spatiotemporal information, facilitates effective crop monitoring. Hyperspectral-based crop vigor monitoring can be achieved through vegetation indices and dynamic monitoring methods integrated with GIS technology. Hyperspectral remote sensing utilizes vegetation indices (such as NDVI and DVI) to classify farmland surface cover types and analyze crop vigor. For example, by analyzing NDVI and DVI derived from hyperspectral data, a regional cover index model can be established to reflect spatial differentiation and seasonal variation patterns of crop coverage.


Forest Pest and Disease Monitoring

ba2acead-0105-4d68-bbea-3fe83035f5fe.png


Forest pests and diseases represent one of the major disasters affecting China's forest resources, causing significant annual losses and severe negative impacts on the ecological environment.

Hyperspectral remote sensing technology exhibits strong advantages and great potential in forest pest and disease monitoring. Current research focuses on utilizing hyperspectral imagery and data analysis techniques to study changes in trees following pest or disease infestation, establish relationships between the severity of damage and variations in original spectral data or vegetation indices, and identify sensitive spectral bands and critical monitoring periods for different tree species. These aspects constitute the key research hotspots in applying hyperspectral remote sensing to forest pest and disease monitoring.


Tree Species Identification

ba07df5c-3cd3-4710-be2a-31651636405a.png

The primary objective of forest tree species identification is to extract thematic information on tree species, thereby providing a foundation and basis for classifying forest types, creating forest distribution maps, and conducting forest resource inventories.

Currently, both domestic and international research utilizing hyperspectral remote sensing for tree species identification is primarily conducted across three scales: leaf, canopy, and hyperspectral imagery.

  • Leaf-scale identification primarily involves analyzing leaf reflectance and its transformed data using statistical methods and genetic algorithms, with a focus on feasibility analysis and identification potential.

  • Canopy-scale identification mainly employs remote sensing image classification methods based on spectral information, such as Spectral Information Divergence and Spectral Angle Mapper, utilizing reflectance curves of stand canopies obtained by field spectrometers to classify tree species.

  • Hyperspectral imagery-based identification primarily involves preprocessing steps like noise reduction and dimensionality reduction on the images, followed by the application of supervised or unsupervised classification methods for tree species identification.


Tree Species Identification

In a nature reserve in Guangdong, tree species identification was conducted using UAV-borne hyperspectral remote sensing. This technology effectively identified the growth distribution of the primary target species—Pinus kwangtungensis (Guangdong five-needle pine)—within the monitored area of a natural mixed forest.

图片11.png

Biodiversity

68c3d08e-15c2-49f5-b325-a811d4ef8716.png      

Effective biodiversity conservation urgently requires rapid and accurate collection of terrestrial plant diversity information. The emergence of hyperspectral remote sensing provides a technical foundation and opportunity for plant diversity research at large spatial scales.

Hyperspectral remote sensing retrieves biodiversity through direct and indirect approaches. The direct approach focuses on spectral curve characteristics, based on the Spectral Variation Hypothesis, aiming to directly establish a relationship between spectral information and plant diversity. The indirect approach links spectral information to plant diversity through vegetation indices, or calculates functional diversity metrics by quantitatively retrieving functional traits, thereby enabling indirect estimation of plant diversity.

The integrated application of hyperspectral remote sensing with other technologies, such as ground flux monitoring, LiDAR, and computer visualization, represents a promising new direction in biodiversity research.


Disaster Assessment and Insurance Loss Adjustment

7936d3cc-98bf-4773-9d55-d96ec9420f45.png


The use of UAV-borne hyperspectral technology enables the assessment of crops affected by diseases, pests, or natural disasters. It accurately identifies affected areas and measures the extent of damage, thereby determining the severity of the disaster. Simultaneously, it serves as a quantitative basis for insurance loss adjustment.

By applying spectral analysis technology for crop identification and disaster assessment, this approach allows for rapid determination of disaster types and severity levels, along with intelligent verification of the affected area. By comparing data with cloud-based databases, it provides agricultural producers with effective management solutions and preventive measures. This addresses key challenges in agricultural insurance surveys, such as time-consuming processes and difficulties in loss assessment, while laying the technical foundation for shifting from post-disaster compensation to mid-term risk prevention and management.


message

If you would like to contact us, please fill out the form below so that your inquiry can directly reach the appropriate contact person.
Tel
+86-571-83729176
Phone
15305811932 (Wechat)
Email
sales@hhitgroup.com
Address
Room 503, Building 2, HIAS Sci-Tech Innovation Park, Yunqi Town, Xihu District, Hangzhou, China

All Rights Reserved@Hangzhou Hyperspectral Imaging Technology Co., Ltd. 浙ICP备19040412号-2 网站地图

Design By: Yushangweb